|![[Search]](https://talks.cam.ac.uk/images/search.gif?1209136071) |
|![[A-Z Index]](https://talks.cam.ac.uk/images/az.gif?1209136071) |
|![[Contact]](https://talks.cam.ac.uk/images/contact.gif?1209136071)
| COOKIES: By using this website you agree that we can place Google Analytics Cookies on your device for performance monitoring. | ![[Talks.cam]](https://talks.cam.ac.uk/images/talkslogosmall.gif?1209136071) |
University of Cambridge > Talks.cam > mh903's list > Cartographic Lines as Travel Pathways of Climate Knowledge: Alexander von Humboldt's Climate Map
Cartographic Lines as Travel Pathways of Climate Knowledge: Alexander von Humboldt's Climate MapAdd to your list(s) Download to your calendar using vCal
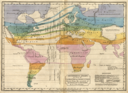
If you have a question about this talk, please contact Mike Hulme. The climate is invisible. Humboldt’s climate zone map of 1817 dates back to the early history of graphic-analytical methods, which we now call data visualisation. It offers a first picture of climate zones based on measurements. While today we are surrounded by infographics on almost all topics, around 1800 there was hardly any knowledge presented in this form. Humboldt’s climate map remains surprisingly abstract, resembling an idealized diagrammatic scheme rather than an executed map. The lecture focuses on Humboldt’s drawing practice and his pictorial thinking. It is here the specific “thought style” (Ludwik Fleck) of a “Humboldtian Science”, as described by historians for the 19th century, that can be connected with the history of data visualization. This talk is part of the mh903's list series. This talk is included in these lists:Note that ex-directory lists are not shown. |
Other listsIsraeli Film Club Graduate Development Lecture Series Cambridge and Anglian Materials Society meetingsOther talksLiterature of Loss (3-4 October 2019) Angular momentum of early type galaxies based on extended kinematics Computing all zeros of harmonic mappings in the plane The Structure-Adaptive Acceleration of Stochastic Proximal Gradient Algorithms MICRODROPLET GENE SEQUENCING - A LOT CAN HAPPEN IN A TINY SPACE! Repeated Measures and Mixed Model ANOVA |


 Thursday 03 October 2019, 17:00-18:00